W1, SW1, W2, SW3, SW7, W8, NW1
Key Headlines
Take-up
Q4 2019 WE Prime rent
Q4 2019 West End Vacancy rate
Q4 2019 West End take-up
Take-up by Business Sector
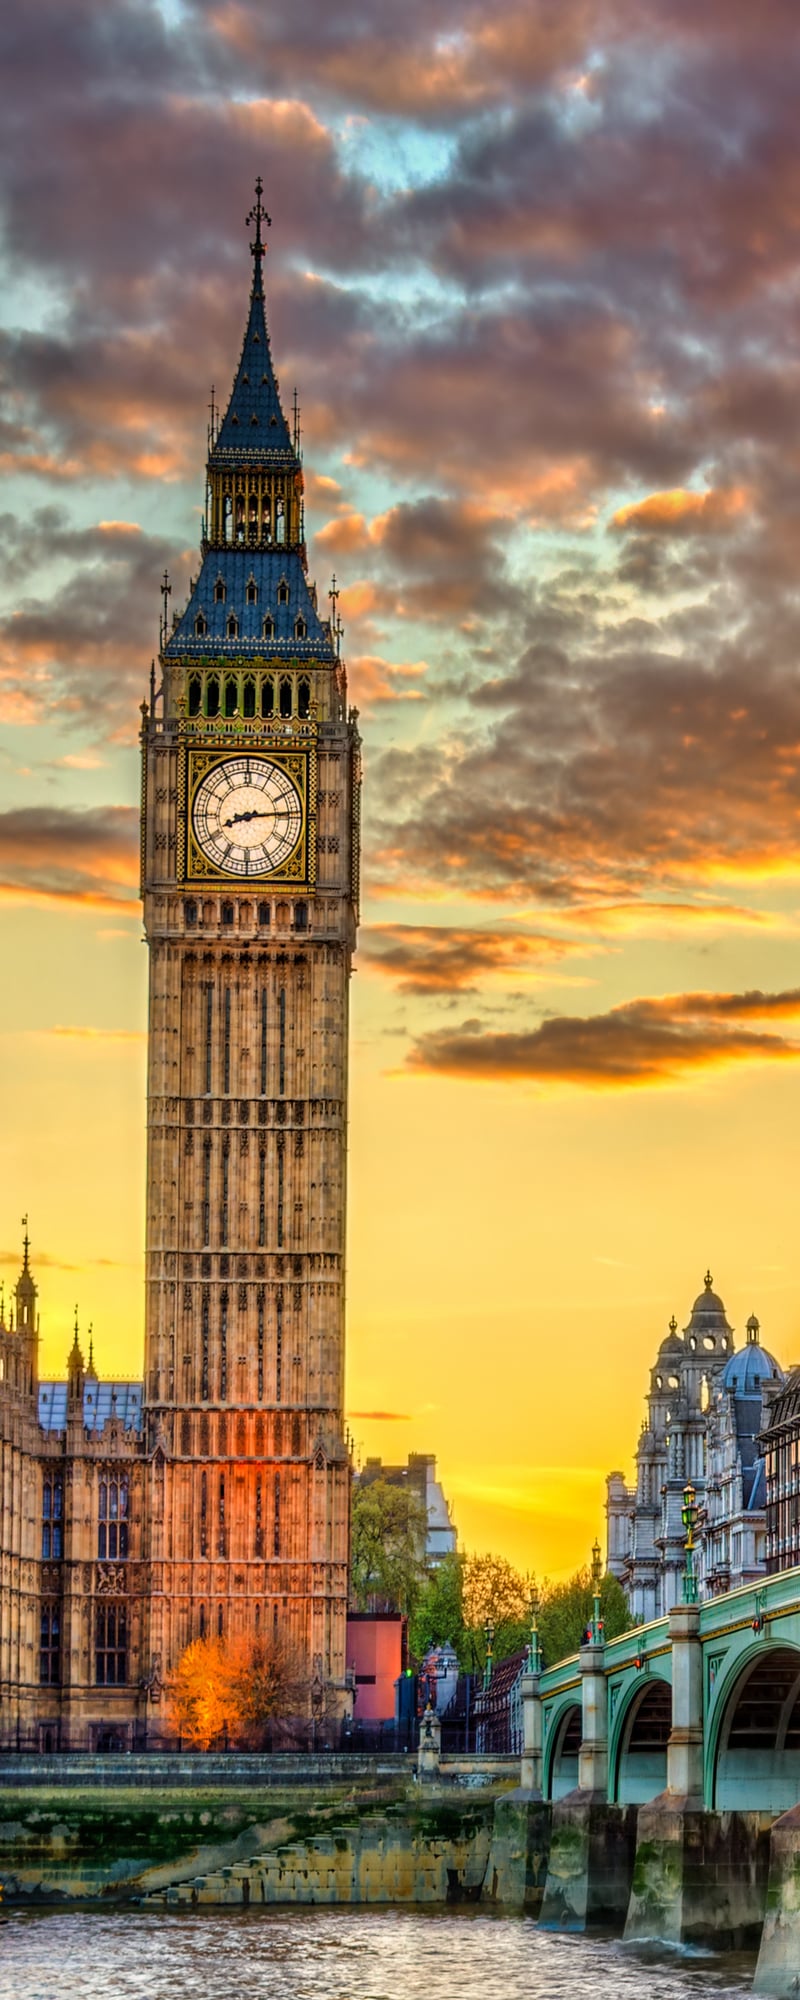
WC1 & WC2
Despite a rise (+12%) on the previous quarter, take-up in Midtown remained below average levels reaching 0.2m sq ft in Q4 2019. This carries 2019 take-up levels to 0.8m sq ft, a 36% decline on 2018 (1.3m sq ft) and below the LT annual average (1.2m sq ft).
Although there are notably a lack of larger deals in 2019, the largest deal to complete in Q4 was to Knotel taking 42,750 sq ft at The Eye, 110 High Holborn, WC1. This boosted take-up levels in the Serviced Office sector, making it the dominant driver of take-up in this submarket (22%) on par with 2018. The Banking & Finance sector followed (16%).
Vacancy rates
Q4 19 Midtown Prime rent
Q4 2019 Midtown End vacancy rate
Q4 2019 Midtown take-up
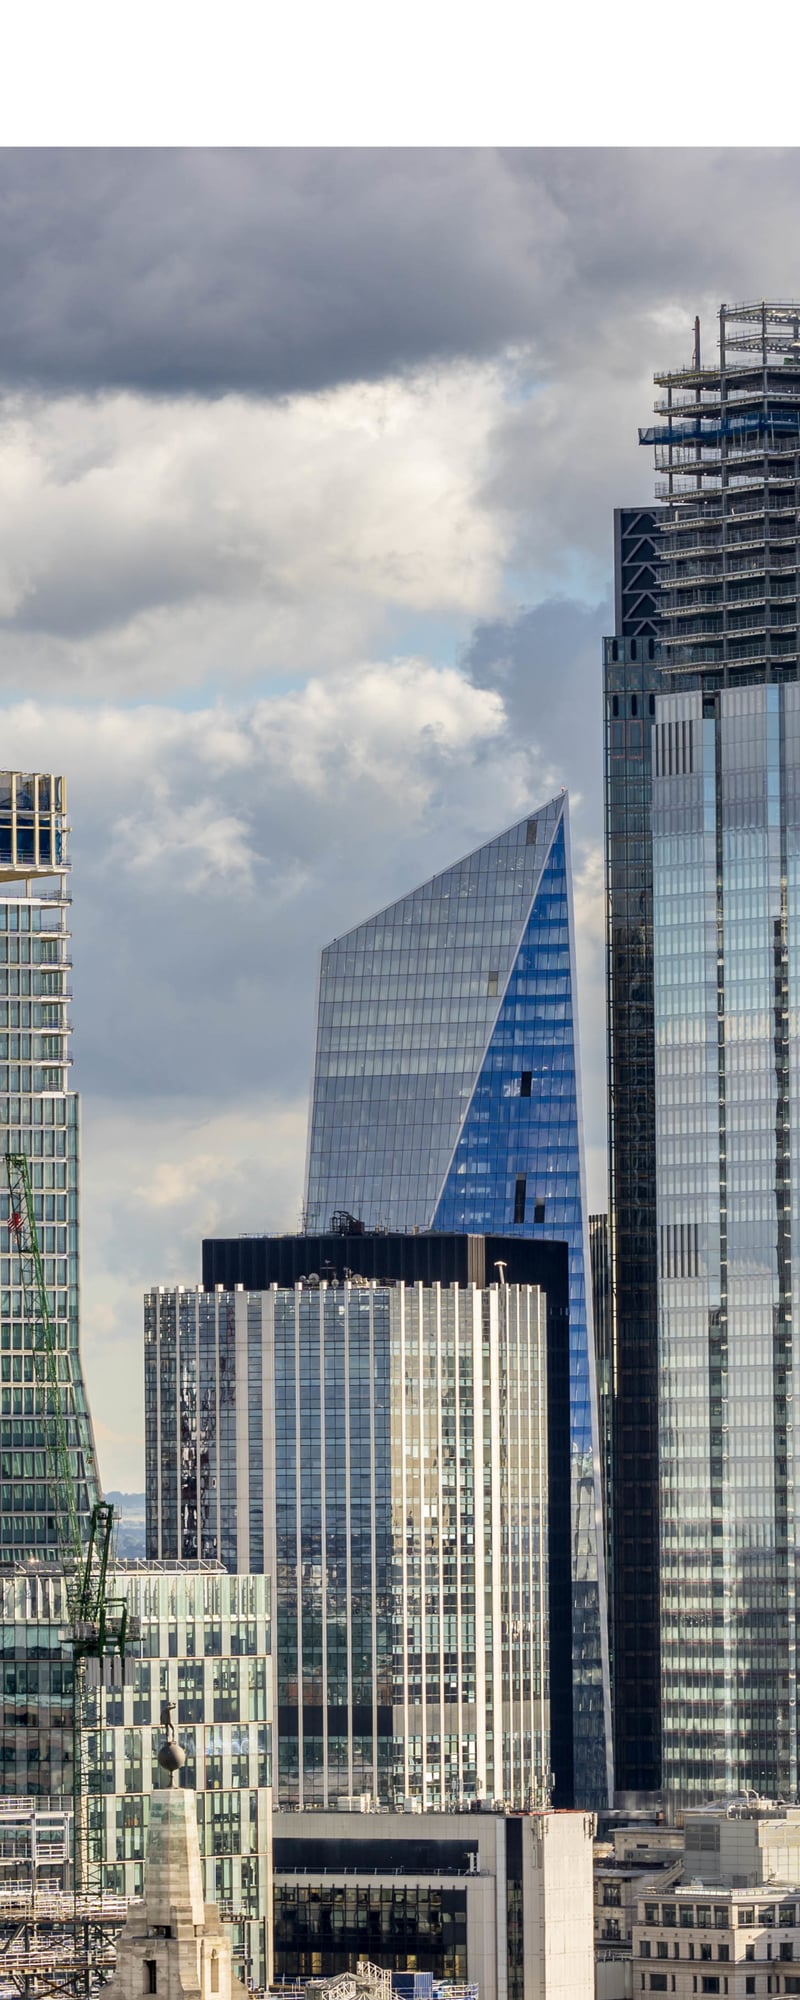
E1, EC1. EC2, EC3, EC4
KEY HEADLINES
Take-up in the City reached 1.6m sq ft in Q4 2019 which is down (-14%) on the previous quarter (1.8m sq ft) but marginally ahead of the long term quarterly average (1.5m sq ft). This brings 2019 take-up to 6.0m sq ft, 22% below 2018 (7.6m sq ft) and finishing the year in-line with the LT annual average.
In addition to Apple’s deal at 22 Bishopsgate, EC2, Monzo acquired 122,280 sq ft at Broadwalk House, 5 Appold Street, EC2 which provided a boost to take-up figures in the City.
In 2019 there were strong levels of demand from the Media Tech sector, accounting for a take-up share of 19% up on 15% in 2018. The Banking & Finance sector followed closely (17%).
4.3m sq ft of developments reached completion in the City in 2019, on par with development completions in 2018.
The vacancy rate reached 6.5% in Q4 2019, and remains below the LT average (7.9%).
Q4 2019 City Prime rent
Q4 2019 City Vacancy rate
Q4 2019 City take-up
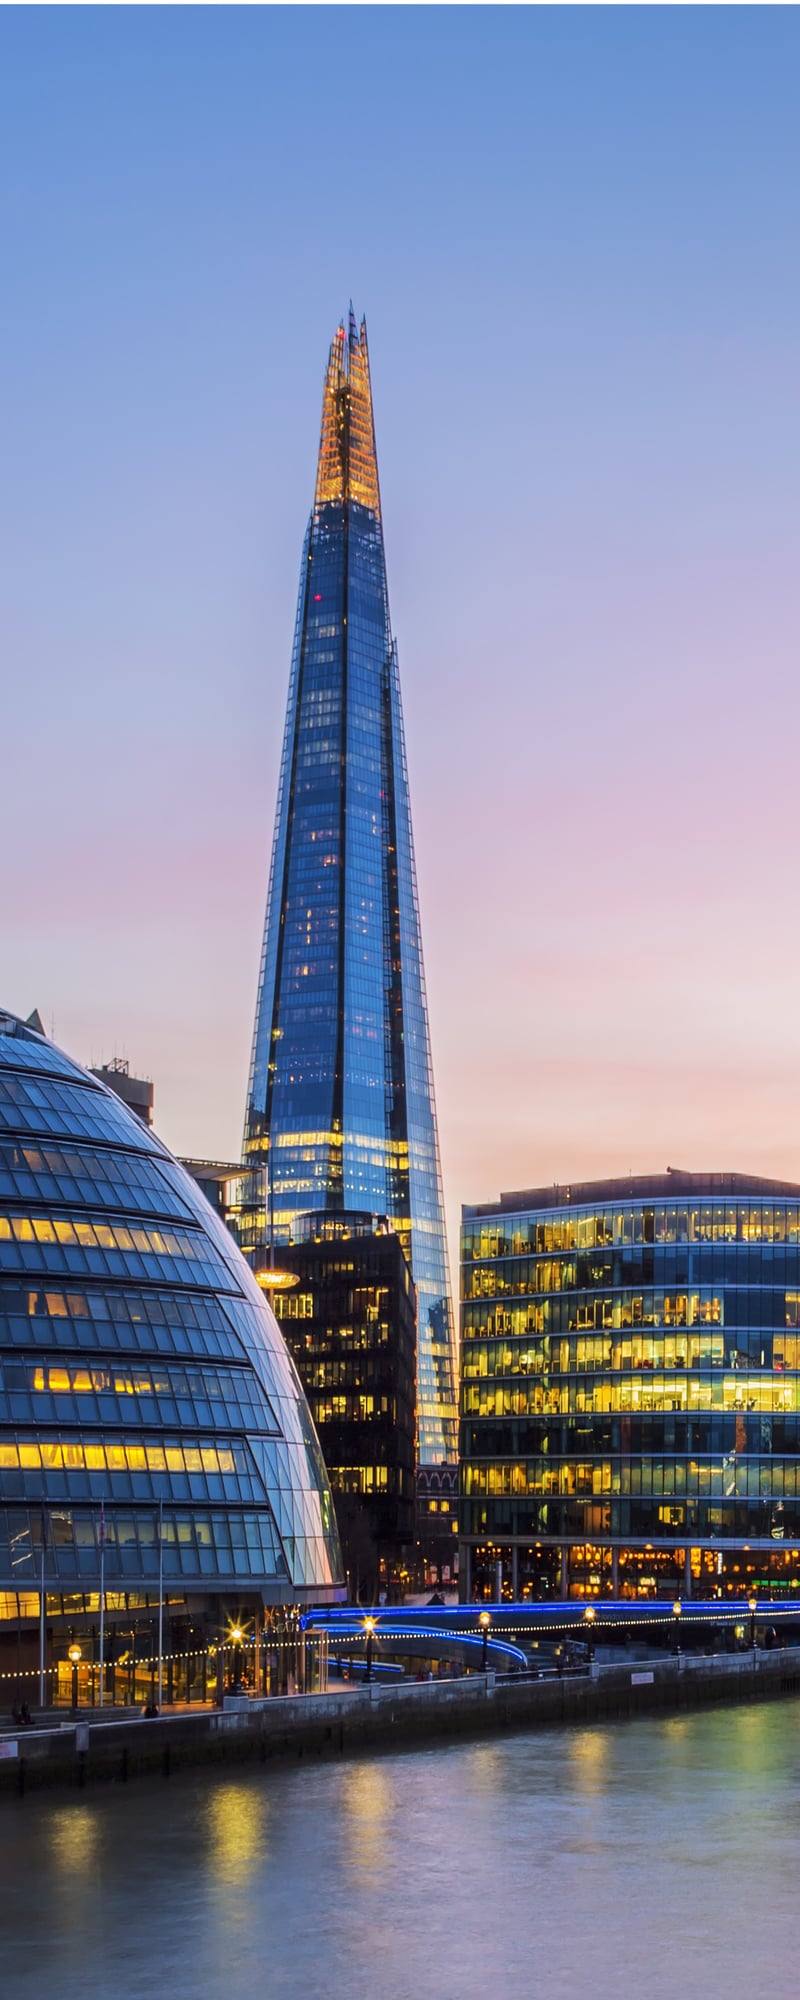
Take-Up
SE1
Southbank take-up in Q4 2019 reached 0.1m sq ft, unchanged from the previous quarter and below the long term quarterly average (0.2m sq ft). This brings annual take-up to 0.7m sq ft, down (-20%) on 2018 (0.9m sq ft) and below the LT annual average (0.9m sq ft).
In 2019 we have seen deals comprising <5,000 sq ft drive demand in Southbank accounting for 69% of transactions, up from 59% in 2018. The largest deal of last quarter was to The Restaurant Group taking 16,373 sq ft at Chandler House, 5-7 Marshalsea Road, SE1.
The Media Tech sector accounted for a 40% share of total take-up in 2019 making it the most dominant sector, up from the sectors share in 2018 (20%). The Services sector (10%).
Southbank remains one of the most supply restrained markets in Central London standing at 0.4m sq ft. The vacancy rate in Southbank stood at 2.0%, below the LT quarterly average of 5.0%.
Q4 2019 Southbank prime rent
Q4 2019 Southbank Vacancy rate
Q4 2019 Southbank take-up
E14
Q4 2019 Canary Wharf prime rent
Q4 2019 Docklands vacancy rate
Q4 2019 Docklands take-up